The logic for Genealogy clusters has been around for a long time. DNA clustering has similarities to this but uses your DNA.
DNA clusters – What are they?
The method separates your DNA matches into DNA related clusters. Each cluster has common DNA traits that help identify individuals who shares a unique DNA relationship. These clusters aid you in identifying where individuals may fit in your family tree.
What are the benefits?
- It helps identify special DNA related family relationships.
- A cluster can provide a clue where to focus your traditional genealogical research.
- Identify one person in a cluster; it likely means the others in the same cluster are closely related.
- Clusters can be sorted in a variety of ways to suit various research needs.
- The cluster report usually provides a direct WEB-link back to the individuals data.
- It is possible to identify endogamous groups.
- You can identify an individual who matches two DNA groups and may be cross related.
It is likely that you have already used some DNA cluster tools without realizing it.
Depending upon where you took your test, these cluster tools are:
- 23&Me – “Relatives in Common”
- Ancestry – “Shared Matches.”
- Family Tree DNA – “In common With.”
- GEDmatch – “People who match both Kits.”
- My Heritage – “Shared DNA Matches.”
Where did DNA Clusters come from?
The process was originally created by Dana Leeds.
There is a manual process for creating clusters using a spreadsheet.
You can read how to do this at: https://www.yourdnaguide.com/leeds-method
This document covers creating manual clusters and then provides information about automated clustering tools.
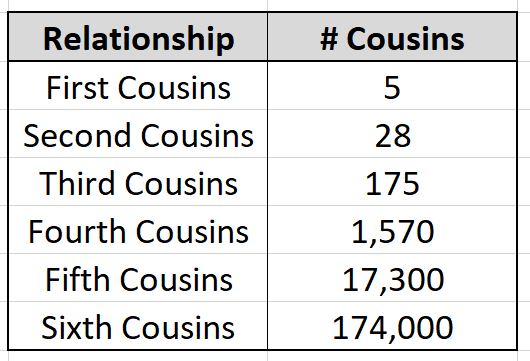
Try and limit your research – How many cousins do I have?
As we go though the process of looking at DNA, anyone who is listed as a fifth cousin is going to prove a challenge unless you both have good family trees or possibly you may get lucky. Try and set boundaries for your research.
What is manual Clustering, how and where can I use the process?
Manual clustering (the Dana Leeds process) may be used for Ancestry, FamilyTreeDNA, 23&Me, MyHeritage, Gedmatch, Living DNA plus other DNA testing sites. If using 23&Me, multiply the percentage by 68 to arrive at and approximation for the number of centimorgans (cM).
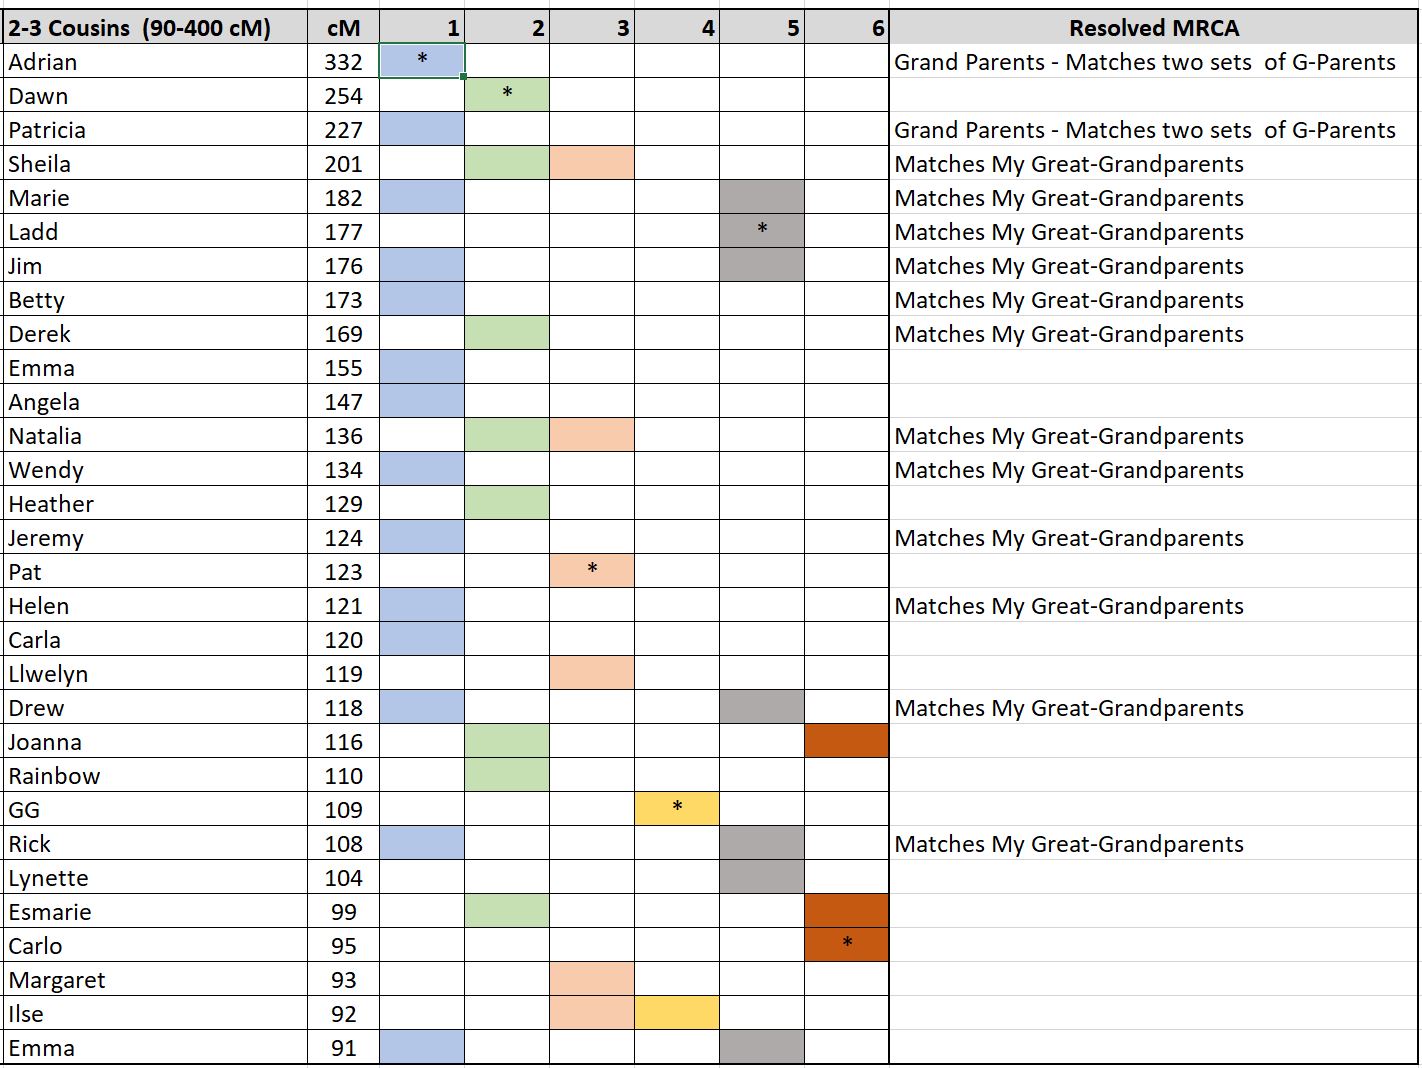
The following is a manual cluster created from Ancestry.com using the Leeds method and MS-Excel. Notice there are six columns.
What am I looking at?
- I limited the Ancestry DNA matches between 90 and 400 centimorgans.
- This frequently covers second and third cousins.
- If it includes known first cousins, remove them from the list as their closest match will probably match your Grandparents, not your Great-Grandparents.
- Second and third cousins translate to your four sets of Great-Grandparents.
- Boxes with a ‘*’ will be explained later in the document.
First, something about Centimorgans
Centimorgans or (cM) are used by most companies as a determination of how genetically close two matches are. However, there is no fixed number for cM’s that define each cousin relationship. The range for each relationship has a span which is variable between full and half-cousins with an average for each relationship.
If we look at a centimorgan chart, you will see that a full-second cousin has a match range of 41-592 with a median range averaging 229 centimorgans. A half-second cousin has an average of 120 cM’s.
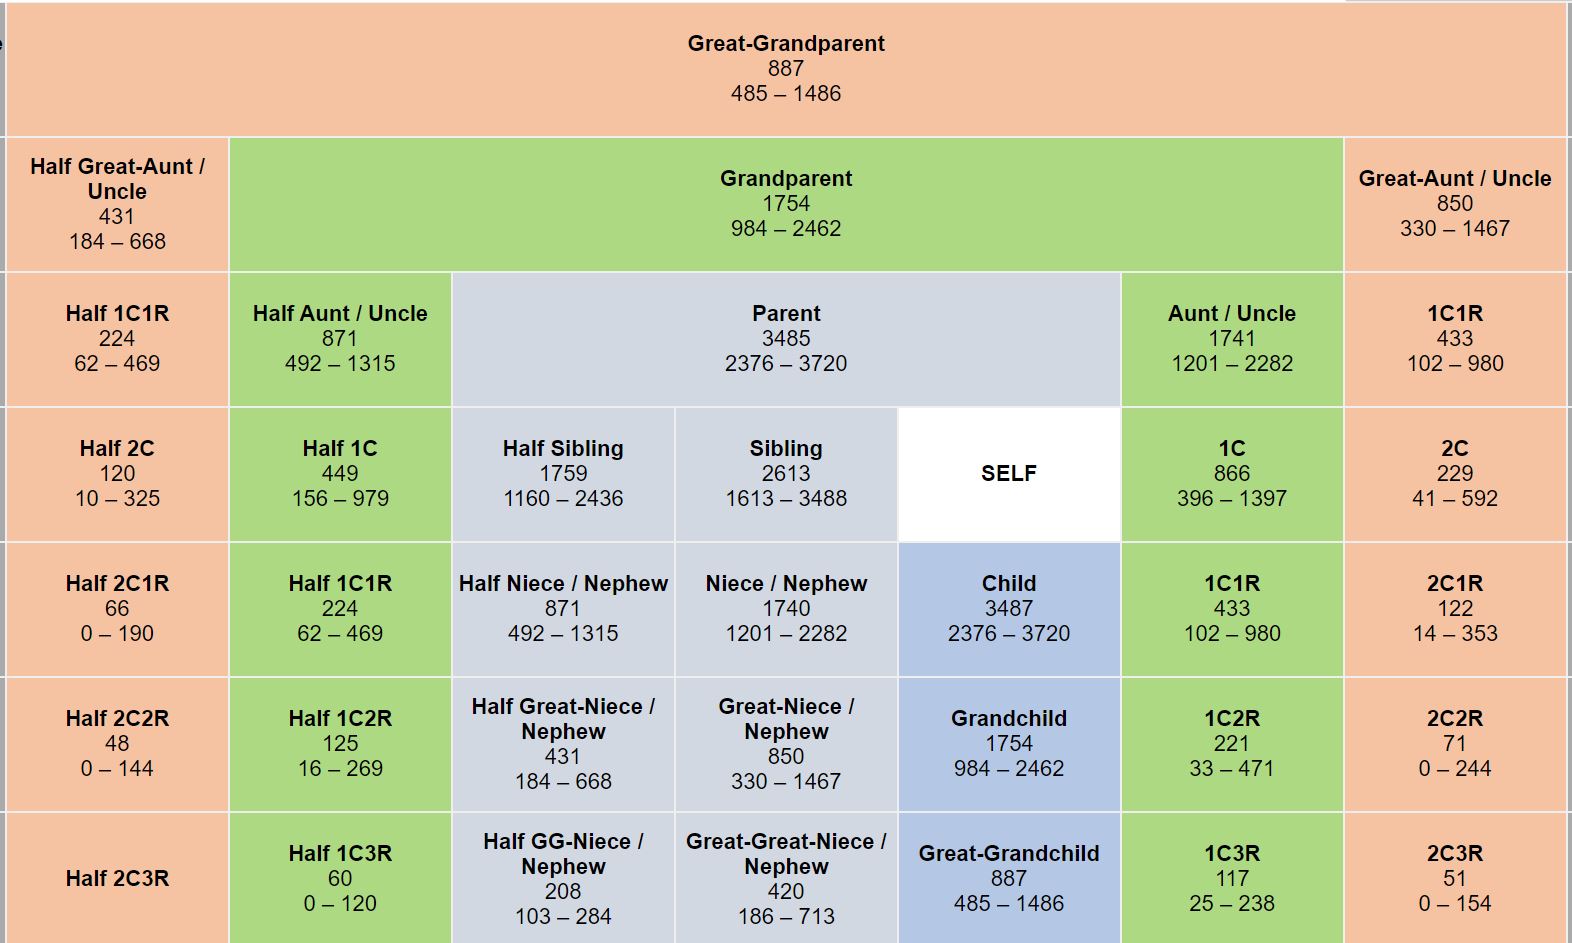
Chart courtesy of DNA Painter – Shared cM tool
Here are two examples of automated clusters
I am doing this because there is some impact upon creating clusters for my family tree. As I will use my data in examples, I need to explain the reason for this.
The first example is an automated cluster, in this case for one for my maternal relatives. This cluster is a sample that is commonly seen when generating an automated cluster. I will explain how to interpret automated clusters later in the document.
Cluster #1 – What you commonly see with some clusters larger than others.
Cluster # 2 – A Large block within a cluster report.
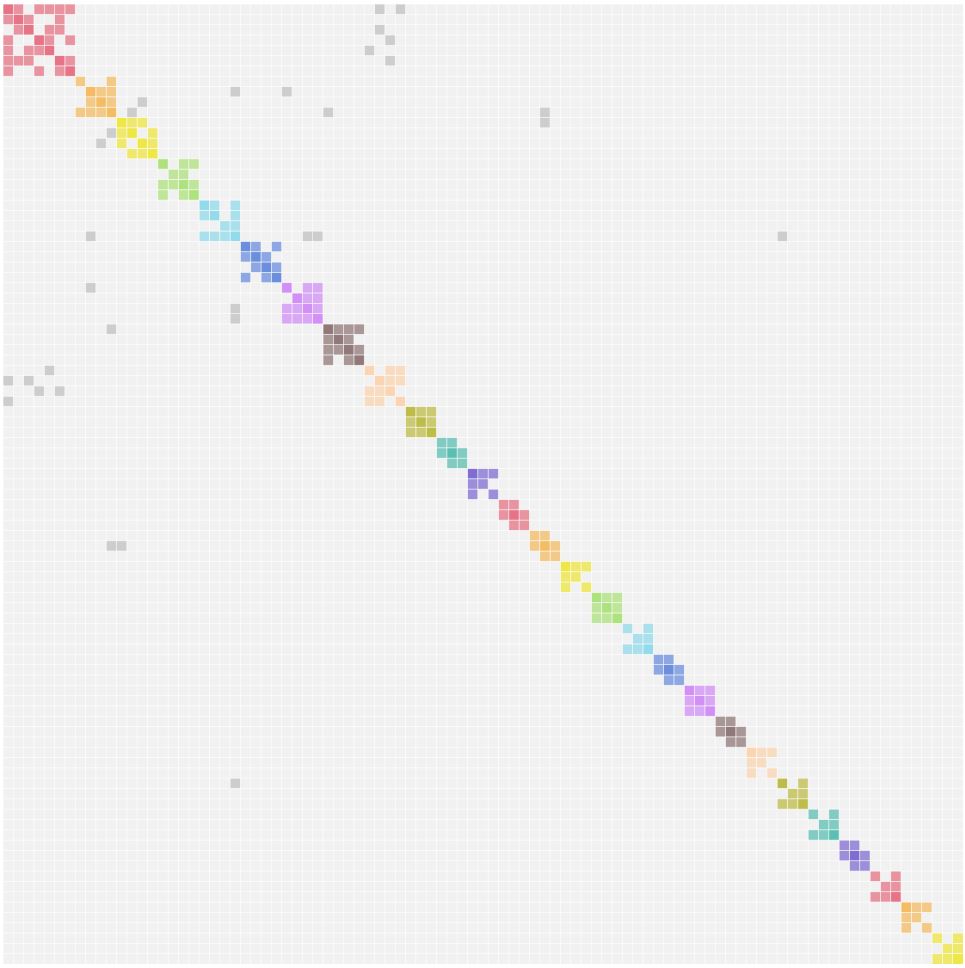
This second cluster (below) was generated from FamilyTreeDNA with a cM range of 50-2,500. Notice the large cluster in this report.
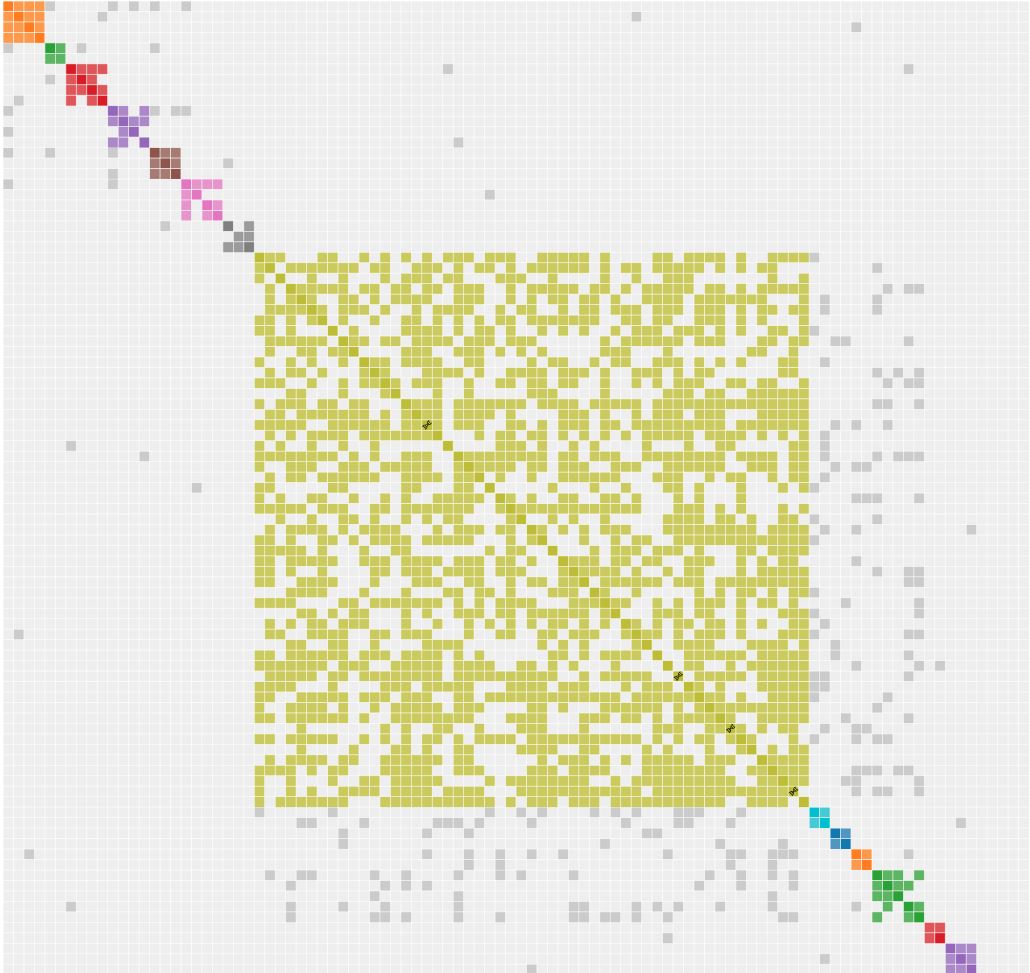
This large cluster is caused by my paternal South African heritage where a small group of Dutch, German, French and other settlers arrived at the Cape in the early to mid-1700’s and tended to intermarry. Sometimes there were multiple marriages as times were tough and frequently, when one partner died, the other remarried.
With additional settlers, including a large group of English settlers in 1812 and later emigrants in the 1950’s, the DNA pool did become somewhat diluted. Even so, the existing pool of marriageable individuals already carried DNA from their ancestors. Marriages and the offspring are beginning to break down the large DNA cluster into smaller ones.
A large cluster such as this usually indicates an endogamous population which can be found in many parts of the world. Including the USA. Endogamous populations present special challenges when analyzing DNA as the DNA is interwoven across many families.
Looking at a manual cluster created from Family Tree DNA
The object of the exercise is to finish up with four columns and colors (four sets of Great-Grandparents). Your results may have more or less than four groups. Notice that some individuals have two or more colors assigned to them (called overlap).
The Dana Leeds Method
What do these reports look like and what do they tell us?
The following is a Dana Leeds worksheet created from FamilyTreeDNA.
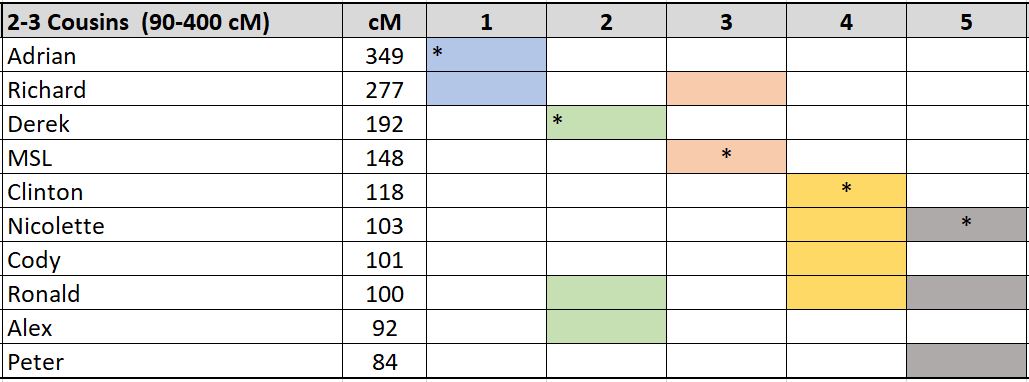
How was this worksheet created?
In some cases, there may be individuals who have a closer Most Recent Common Ancestor (MRCA) match. Adrian and Richard are 1st Cousins, once removed to me and therefore my grandparents are their closest match to me.
Normally first cousins, or first cousins once removed, would not be included in the worksheet because we are looking for second and third cousins. I have chosen to leave them in the worksheet for this and the following examples. The ‘*’ shows which individuals were used to evaluate the relationship. It is these individuals that were used to lookup shared relatives.
This is how the process works.
For each DNA test, list the relatives that are identified and second and third cousins. Add these individuals to column one along with the centimorgans in column two. Then:
- Start with person #1 (Adrian*) and look at their common matches to you. Give each match in column three the same color.
- Look for the next blank line (Derek*). Look up their common matches to you and give them a different color in column four.
- Look for the next blank line (MSL*). Look up their common matches to you and give them a different column five.
- Look for the next blank line (Clinton*). Look up their common matches to you and give them a different color in column six.
- And finally, look for the next blank line (Nicolette*). Look up their common matches to you and give them a different color in column seven.
You now have three or more columns. Grouping the colors helps identify which matches belong with which set of Great-Grandparents. Ideally, you want to have four columns, however if you have more columns, you will need to perform some consolidation.
What is this worksheet telling us?
First, note the cM ranges used for the worksheet 90-400 cM.
This equates to second and third cousins.
It translates to individuals descended from your Great-Grandparents.
In this example there are five columns not four. Each column is evaluated for DNA overlap.
What are the next steps if I have more than four columns?
Take a close look at the following example. The first worksheet is the original analysis.
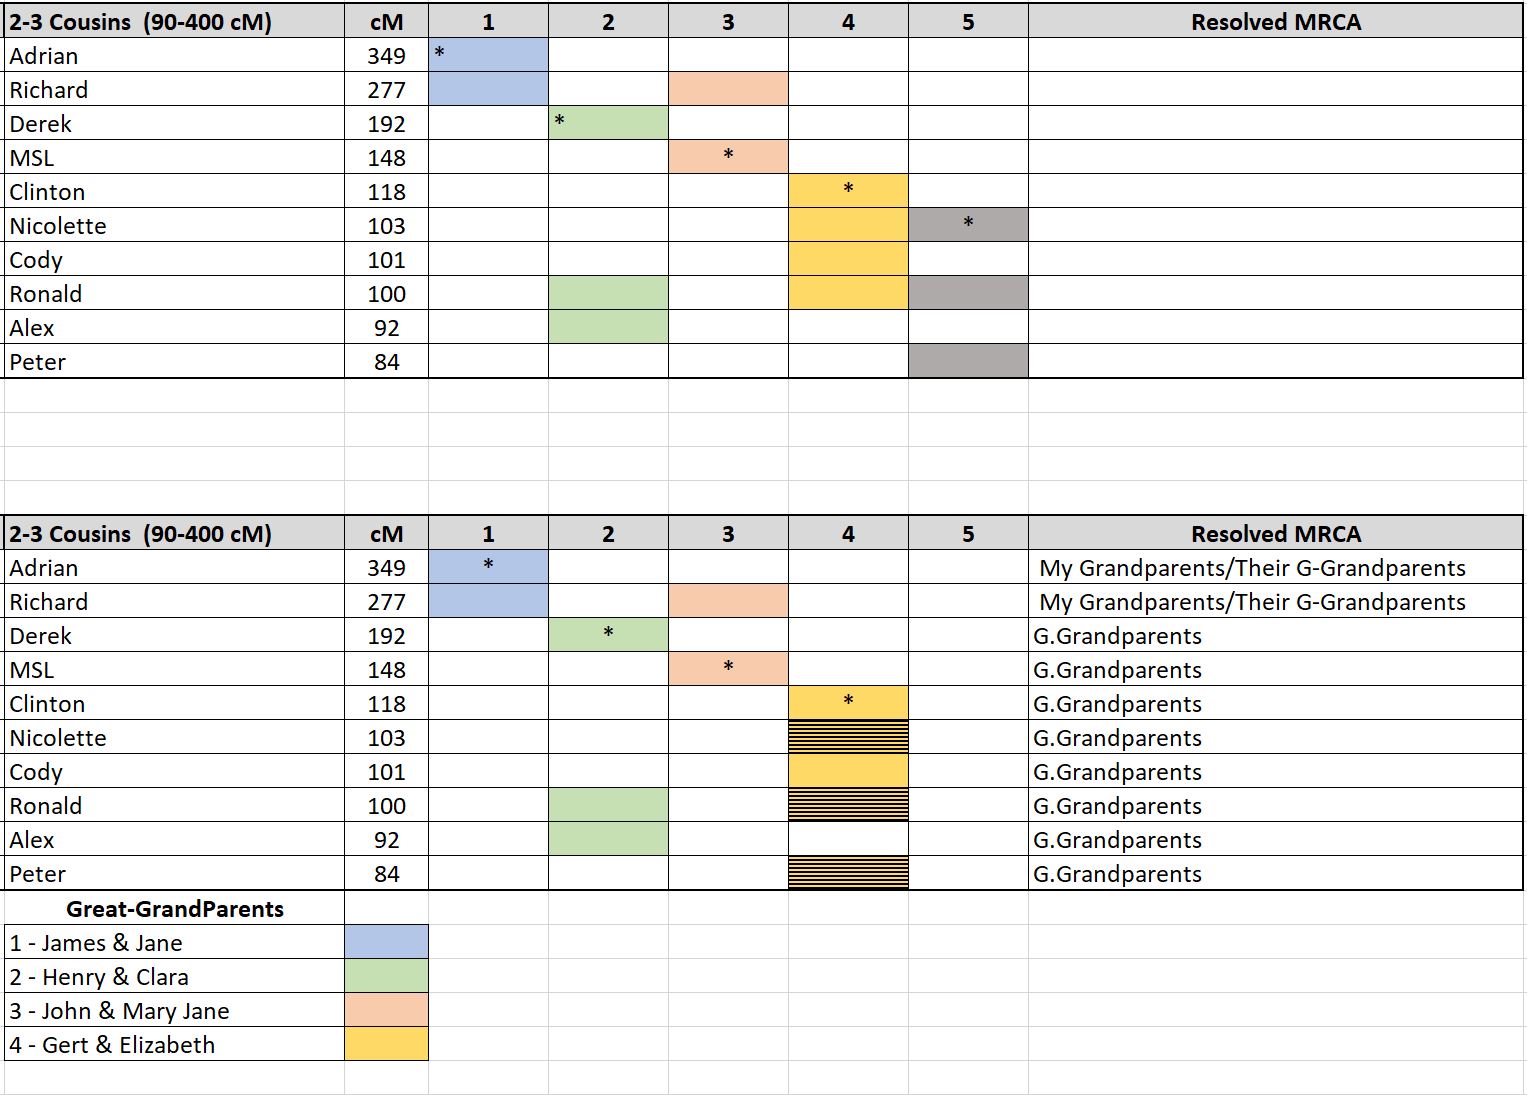
Ideally, we want four columns. Because there is overlap between column four and five, the items in column five have been rolled into column four as overlap shows they share DNA. The second worksheet now shows there are four columns which equates to the four pairs of Great-Grandparents.
Can you use the Leeds Method for fourth Cousins?
Yes, there is a link in the ‘Other Resources’ section at the end of this document that explains how to do this.
How does the same Cluster report look when using the same 90-400 cM’s and is generated automatically?
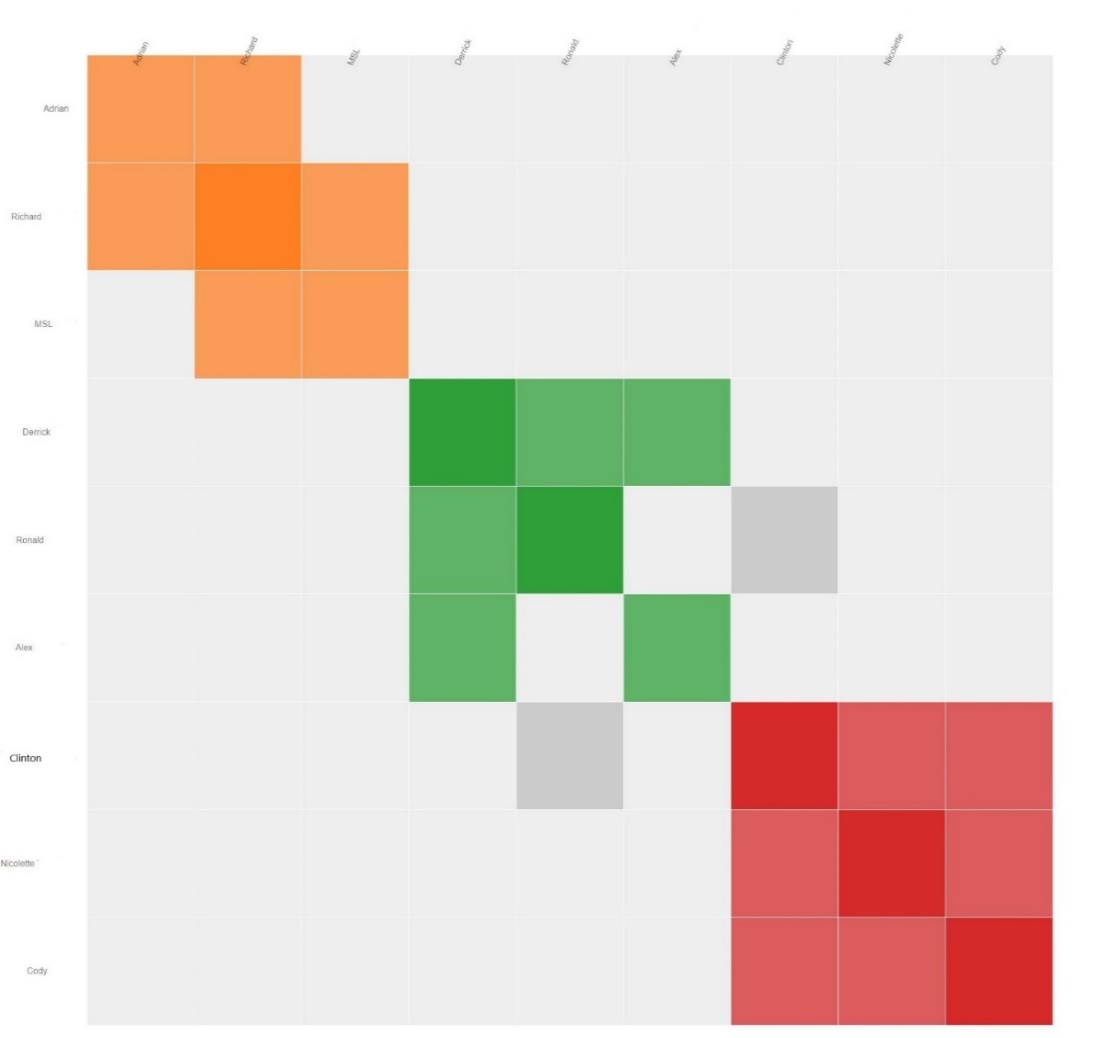
The following report was run using Genetic Affairs against FamilyTreeDNA using the same parameters as the Leeds report.
Notice there appear to be three groups compared to the four in the Leeds cluster. However, the first cluster has an overlap which actually makes it four clusters.
- In cluster one Adrian and Richard share both Great-Grandparents while MSL (cluster two), shares only one set of Great-Grandparents, but has an obvious relationship with Adrian and Richard.
- Cluster three share the same Great-Grandparents.
- Cluster four also share another set of Great-Grandparents.
- Notice the two grey squares. Gray squares indicate a common relationship between at least two clusters. In this case Ronald and Clinton share a relationship with cluster three and four. (South Africa again)
Do not overlook the gray squares. A gray square means the individual, shares DNA between two or more clusters, i.e. there is a relationship between two different family branches.
Gray squares are especially useful as a tool when searching for birth parents.
Creating Automated DNA Clusters with DNA test companies.
Remember, a cluster report is a ‘snap-shot’ at the time it was produced.
As more individuals show up as matches, you need to repeat the process. I repeat the reports every six months to review new matches that have appeared as more people take autosomal or atDNA tests.
Ancestry
- Unfortunately, Ancestry does not provide an automated cluster report.
- Ancestry has legally blocked Genetic Affairs and DNAgedcom from running cluster reports using Ancestry data.
- If you want to create a cluster report, you will need to use the Leeds spreadsheet process or the following approach which uses Ancestry ‘Groups’ rather than a spreadsheet. There is a useful U-Tube Video that explains how to do this at: https://www.youtube.com/watch?v=UBh9X4qi7Xw
My Heritage
If you have a subscription with My Heritage, or have paid their one-time $29 fee per upload, you can create an automated cluster report.
There are fixed parameters for the report, these are:
- Total number of matches 100
- Minimum threshold 40cM
- Maximum threshold 350 cM
- Shared DNA Matches with a minimum threshold 15 cM
The report is sent to you via email.
Genetic Affairs
The following sites do not generate automated cluster reports, however you can either use the Leeds process or use Genetic Affairs: www.genetic affairs.com to generate automated cluster reports from the following sites:
- 23&Me
- Family Tree DNA
- Genetic Affairs offers cluster reports using MyHeritage and GEDMatch
- Genetic Affairs cannot run automated Ancestry Cluster reports due to legal issues with Ancestry.
Genetic Affairs requires a minimum monthly subscription of $5.00 for 550 credits which you then use to run cluster and other reports. Most reports use from 70-100 credits.
First time users receive 200 free credits. Reports are sent via email as a .zip file.
You can specify the cM range you require.
Genetic Affairs offers additional useful tools.
DNAgedcom
- Like Genetic Affairs a monthly subscription is required.
- Like Genetic Affairs, DNAgedcom cannot run automated Ancestry Cluster reports due to Legal issues with Ancestry.
- DNAGedcom also has other useful reports.
GEDMatch
- Provides a useful tool for creating Cluster reports.
- The monthly fee is $10.00, this can be a one-time payment and you can run as many cluster reports as you want during the month.
- You can specify the cM range you require for a cluster report.
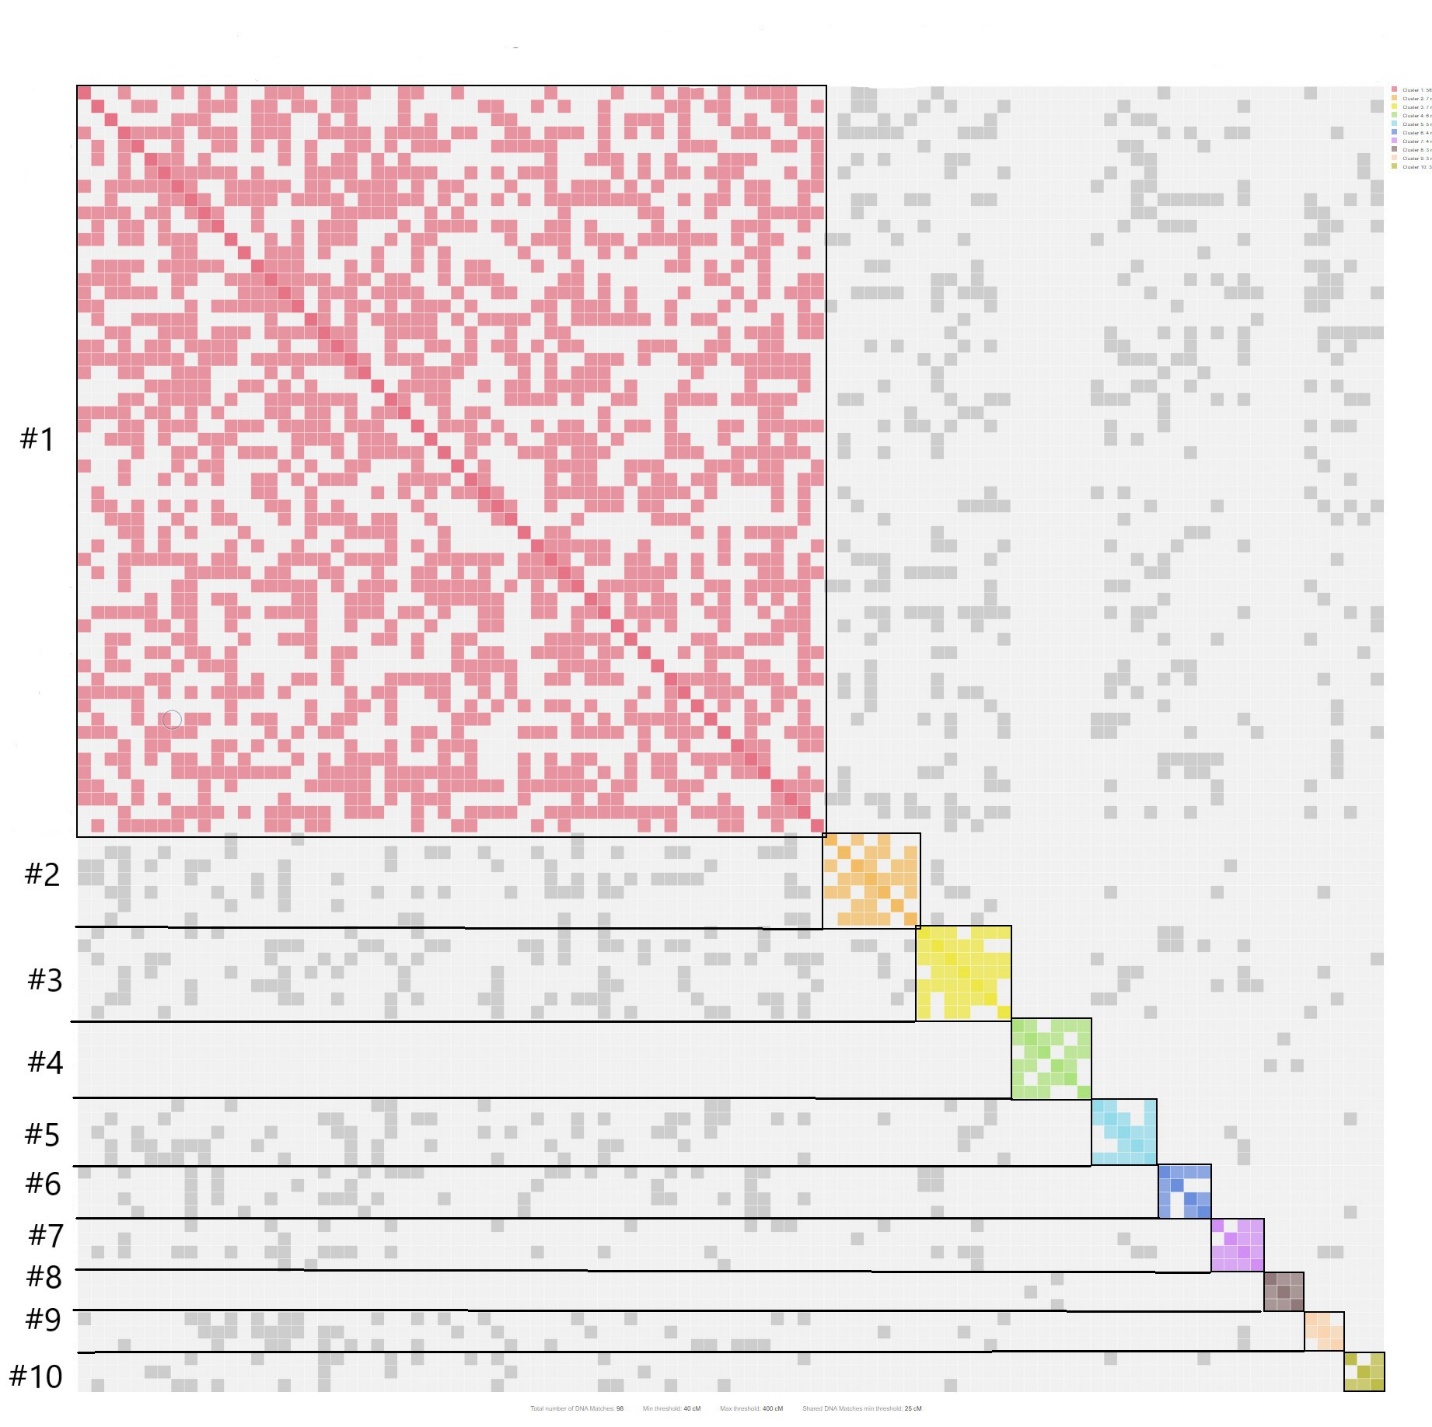
Looking at a larger automated cluster.
This following cluster is from MyHeritage and uses the default parameters of 40-350 cM’s. It includes only 100 individuals with a minimum threshold match of 15cM.
- Cluster one shows my South African paternal heritage and has a large quantity of Gray Squares. This indicates a lot of individual DNA matches between other clusters (endogamy).
- Clusters two and three are also South African families, again there are a lot of gray squares indicating DNA cross relationships with cluster one.
- Clusters four and eight belong to my maternal (English) family. Notice the few DNA cross matches.
- The remaining clusters in the report are from my paternal, South African family.
Why so many South African clusters?
This is indicative of a high level of interest in genealogy and DNA testing that occurs in certain countries. While I have a much larger English family, few of my English cousins have invested in DNA tests.
There is a similar occurrence with my wife’s Norwegian heritage where there is a larger series of clusters originating from Norway than from the USA.
What else can you do with Clusters?
If you have a subscription with DNA Painter, you can load a cluster report into a Chromosome Map.
This works for reports for the following companies:
- Genetic Affairs
- MyHeritage
- GEDMatch
- DNAGedcom
This process results in a visual image of the individuals in the cluster by chromosome, including their position on the chromosome. The following Example uses the same MyHeritage cluster report used in the example above. The result looks like this:
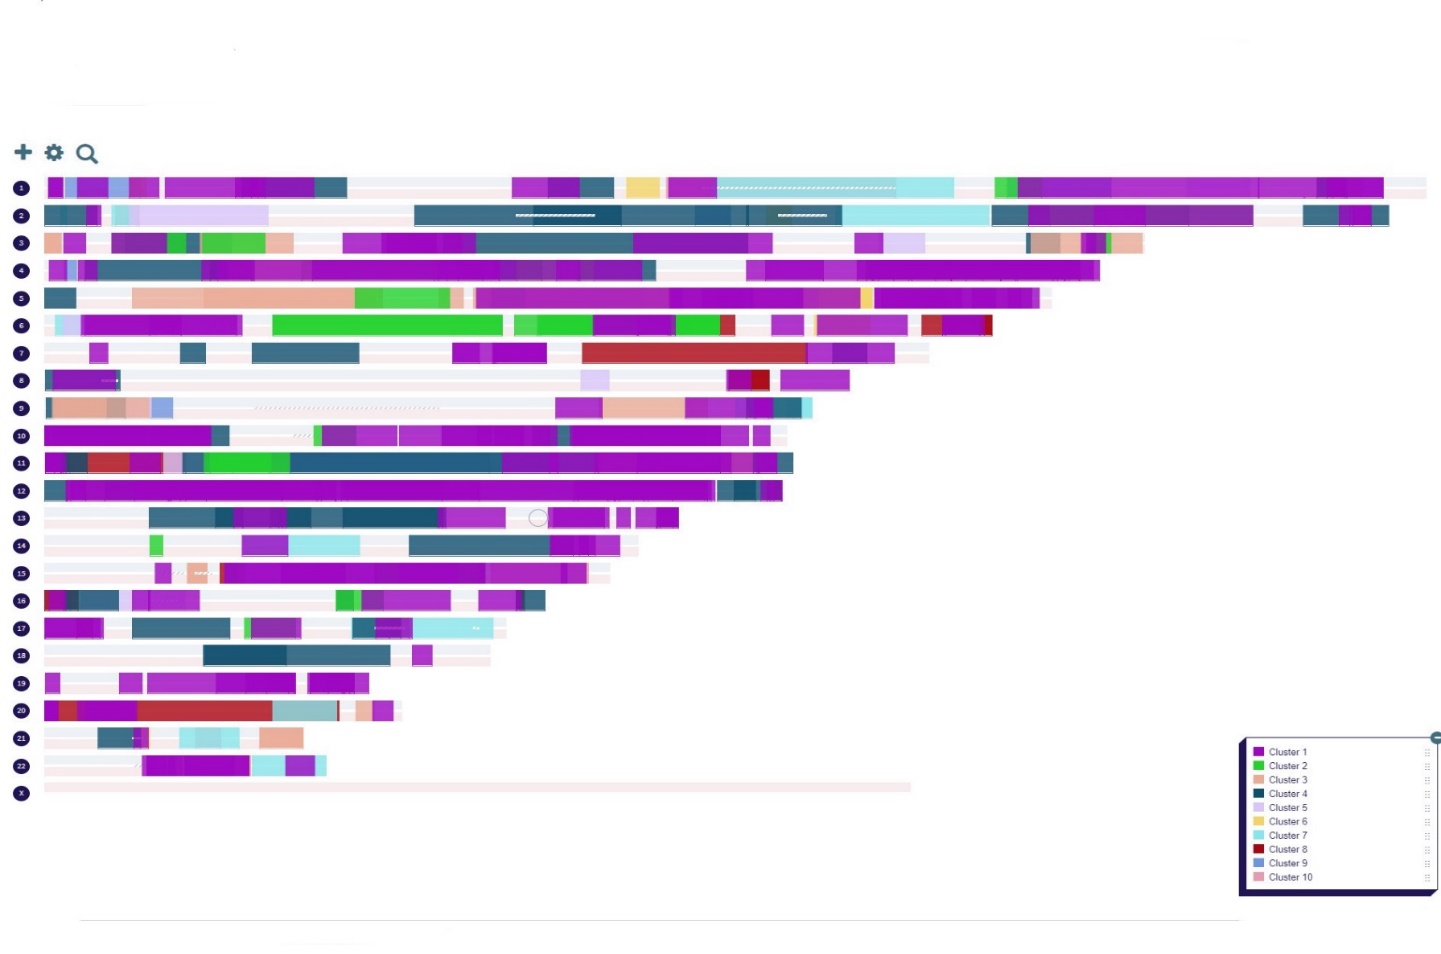
- One advantage of porting your cluster report into DNA Painter is you can compare the individual relationships by Chromosome.
- As DNA Painter does not know if a match is paternal or maternal match, it assigns the match to both of your parents.
- DNA Painter allows you to reassign a known individual to a new group that you create i.e., paternal, or maternal group or even deeper ancestral groups like Great-Grandparents or even GG-Grandparents.
- As you move known individuals into one of these new groups and assign them to a paternal or maternal relationship, you can begin to compare unknown individuals in the cluster with known individuals.
I trust this document will help you understand more about clusters and how they work.
Resources
Another way of creating clusters within Ancestry using Ancestry Groups.
The Dana Leeds Blogsite – Explains how to use her method
Dana Leeds – Working with fourth cousins
The Leeds Method with Ancestry.com’s Colored Dots
DNA Explained – useful explanations and suggestions related to DNA.
DNA Explained & Genetic Genealogy – The Leeds Method
Data Mining DNA – Discusses using fourth cousins in the Leeds method.
Kitty Coopers Blog – Always a useful resource as she talks about clustering.
Companies mentioned in this document.
Books
Your DNA guide – Diahan Southard
The Family Tree Guide to DNA Testing and Genetic Genealogy – Blaine Bettinger
Clustering DNA Matches: Using Ancestry DNA Matches – Larry Jones